
Modality
Computed Tomography (CT)

Introduction
Computed tomography, more commonly known as "cat scans" or "CT scans", are cross sectional, two dimensional gray scale images. They are very commonly used in the practice of clinical medicine. This module will serve as an introduction to CT, and provide you with information that will help you to understand what you are looking at when you view an image.
How Images Are Obtained
CT images use x- rays to obtain a thin axial image of the patient- a “slice”. To obtain CT images, the beam of x-rays and the x-ray detector circle around the patient, continuously producing and detecting a thin beam of x-rays that pass through the patient. This is in contrast to radiographs, where a stationary x-ray beam source and detector are used.
The CT Scanner
The patient lies on a table that slowly moves through a circular tube, called the gantry. The gantry houses the generator that produces the x-rays as well as a specialized x-ray detector. The two are located 180 degrees apart from one another. The generator and detector move in unison around the patient, continuously transmitting a thin beam of x-rays through the patient. Those that are not absorbed by the patient are sensed by the detector and transmitted to a computer. The data is analyzed and an image produced which represents one "slice" of the patient.
Traditionally, with each 360 degree rotation of the x-ray beam and detector, data is obtained from that axial section of the patient. The table then moves, and another axial section of the patient is obtained. With newer CT scanners, the table moves continuously through the gantry, and the generator and detector continuously circle the patient. As a result, instead of a single “slice” of the patient being obtained with each rotation, a continuous helix of data is obtained. A specialized computer interprets the information from the detector and transforms it into images, which represent sequential “slices” of the patient.

Viewing the Image
Images are viewed as though the patient is lying down on his/her back and you are standing at the foot of the patient looking towards their head. The patient's right side is displayed on the left of the image, and the left side on the right. Images are generally displayed in the order they are obtained, from superior to inferior. In this way, structures can be followed from image to image. If you aren't sure which structure you are looking at, try looking at the slice above or the slice below to help follow the structure and determine its origin.
Below are two sequential CT images of the upper abdomen; the image on the left is 5mm superior to the image on the right. Each of these images represents a slice of the patient which is 5 mm thick.
The superior image is taken through the superior aspect of the pancreas ("P") and not much of the organ is visible on this slice. This makes it difficult to identify. Looking at the image just below will help, as more of the pancreas is now visible allowing appropriate identification of the structure. Note the right kidney is not visible on the superior image. The second, more inferior image shows the most superior part of the kidney, "K".


Factors Affecting the Appearance
CT images are produced with ionizing radiation, similar to radiographs. Therefore, some of the factors affecting the appearance of the CT images are similar to radiography (for example density).
On CT, the density of a structure, the image display, and the use of iv contrast enhancement are the main factors affecting the appearance of structures. Shape and thickness do not affect the final CT image as much as they do in radiographs, since CT images are summations of only thin slices of superimposed structures.
The data obtained can be displayed (or "windowed") to highlight certain structures. The two chest CT images shown are from the same set of data at the same level. The left image is displayed in "lung" windows and the right in "soft tissue" windows. Note that lung windows show the lung parenchyma (small blood vessels, bronchi, and airspaces), but one is unable to distinguish the soft tissue structures well. Soft tissue windows show the muscles, fat and blood vessels well, but not the lung parenchyma.


Density
Since x-rays are used to obtain CT images, the density of a structure affects the final image of a CT in a similar manner.
Dense structures, like bone, attenuate more of the x-ray beam and appear white. Less dense structures, like air, attenuate less of the x-ray beam and appear black. Soft tissue structures are of intermediate densities and appear as varying shades of gray.
The CT detectors are much more sensitive than conventional radiograph cassettes. With the detector and beam rotation allowing for the accumulation of many data points in one slice, spatial resolution is excellent, and subtle differences in soft tissue densities are visible which are not noted on routine x-ray.

On CT, soft tissue structures appear as varying shades of gray, depending on the density of the structure. Structures of similar density are easier to differentiate from each other on CT than on radiography.
Note that the fluid filled gallbladder can be differentiated from the adjacent liver, which is higher in density and appears a lighter shade of gray. The spleen and left kidney can be seen distinctly from each other, partially due to the excellent spatial resolution of CT, but also due to differences in density.


Similar to radiographs, when structures of differing densities are next to one another, they can be distinguished from each other.
Note that the low density fat between the right kidney and liver helps to differentiate them. In contrast, it is not possible to see the border between the duodenum and pancreas, since they are of similar densities and there is no intervening tissue of a different density present to help distinguish them from each other.
Contrast Enhancement
In order to discretely identify tissues that are immediately adjacent to one another on CT, their densities must be different enough so that they appear as varying shades of gray on the CT image.
To aid in the differentiation of structures seen on CT, particularly if they are of similar density, intravenous contrast dye (x-ray dye) is often used. The dye is composed of iodine which is quite dense and therefore attenuates x-rays, thus appearing white on CT. The dye is administered to the patient by intravenous injection. When this is done, tissues in the body will take up the contrast and appear a lighter shade of gray than they would without the dye. The more dye that a tissue takes up, the lighter shade of gray it appears on CT; the more it is said to "enhance".
Look at the two images below. The image on the left is "unenhanced" (no x-ray dye was given). Note that the kidneys, liver, pancreas, spleen and blood vessels all appear nearly the same shade of gray. The image on the right is "enhanced" (obtained after intravenous contrast was administered). Note that each organ is a lighter shade of gray than on the unenhanced image, and each now differs from each other in its subtle shade of gray. This results from differences in the amount of x-ray dye that each organ absorbs; the more absorbed, the lighter the shade of gray. The kidneys absorb the most dye and so appear the lightest. Also note that you can see blood vessels in the liver, since they contain a higher concentration of the dye than the adjacent liver parenchyma. Also note the splenic vein, which sits immediately posterior to the pancreas, is now seen discretely apart from it.


What Anatomical Structures Are Well Seen
CT can display differences between soft tissues that differ in physical density by as little as 1%. Most anatomic structures are visualized on CT scans, including bone, air, fluid, fat, and soft tissues.
All of these structures are better demonstrated on CT than on radiography. This results from a combination of factors, including the very sensitive CT detectors that differentiate smaller differences in densities, the excellent spatial resolution CT affords, and the fact that the images are single "slices" of the body (while radiographs represent a superimposition of a number of structures).
Abdominal Structures
Compare these images of the abdomen. The image on the left is a radiograph and the right is a CT image of the mid-abdomen. The radiograph shows the bones well, and air within the bowel, however airless bowel, the individual organs, blood vessels, lymph nodes and other soft tissue structures cannot be seen. In contrast, the CT shows the individual organs, the bowel that contains air as well as the bowel which is airless (fluid filled), blood vessels and all of the fat intervening between and around these structures.


Thorax
Structures in the chest are also well seen with CT, including bones, blood vessels, lungs, trachea, esophagus, fat, as well as the muscles of the body wall.
Compare what soft tissues structures look like on the chest radiograph on the left and the chest CT image on the right. The trachea is seen on the radiograph, since it is air filled and more lucent than the adjacent structures of the mediastinum. Note that the esophagus, blood vessels and muscles cannot be differentiated on the radiograph, but they are easily seen on the CT.

Brain
CT is also an excellent way to view the brain and contents within the skull. None of these can be seen with radiographs.
The image on the left is of the inferior part of the brain, and the image on the right is slightly more superior. Note the low density fluid of the subarachnoid space and lateral ventricles is well differentiated from the varying shades of gray of the arteries supplying the brain, and the brain parenchyma itself. CT also demonstrates the subtle differences in the gray and white matter tracts of the brain parenchyma, which have different compositions and functions. The white matter appears darker than the gray matter.


Indications For Use
CT is widely used to help diagnose a variety of different problems and symptoms. It is excellent for evaluating lung parenchyma, as well as soft tissues of the neck, chest, abdomen and pelvis. It is also a quick and relatively inexpensive way to evaluate the brain.
CT can be used as a primary imaging tool to evaluate a patient's symptoms, or can provide additional information when other tests are inconclusive. CT is currently widely available and easily accessible.
It is beyond the intentions of this submodule to discuss all of the potential uses of CT, but this should serve as a broad guideline to help one understand the general uses of CT.
Chest
CT is widely used to evaluate structures in the thorax. Tumors of the lung or chest wall, infections, emphysema and other chronic lung diseases are well demonstrated on CT.
More recently, CT has become a more powerful way to evaluate the blood vessels in the thorax and the heart. This includes evaluation for blood clots in the pulmonary arteries, atherosclerosis and narrowing in the coronary arteries and aorta, abnormal dilatations of blood vessels (aneurysms), and cardiac function.
Below is a chest CT image displayed in lung windows. Note how well the lung parenchyma is seen; the individual blood vessels and airspaces are visible. Also note that the soft tissues of the chest wall and mediastinum are not seen adequately. When viewing a CT, it is important that the display is set appropriately to allow visualization of the structures of interest. Do you see the mass in the lung?

Below are identical images displayed in different windows. The image on the left is in soft tissue windows and that on the right in lung windows. Both images show the tumor mass in the medial right lung.

Note that the tumor extension into the mediastinum, adjacent to the aorta and trachea is only appreciated on the soft tissue windows. This is not well seen on the lung windows and was not visible on the patient's chest radiograph shown below.

Bone
As discussed earlier in this learning module, radiography is an excellent modality to evaluate the bones. There are instances in which CT is indicated for further evaluation or problem solving. This occurs most commonly in complex intra-articular fractures of the hip, ankle, and knee. CT is also used to evaluate tumor infiltration into bone.
Note in the radiograph of the knee on the left, the fracture of the proximal tibia is easily seen (arrows). The CT image on the right is a coronal reformat of a CT of the knee. Note that the complexity of the fracture is shown with greater detail on the CT image. It is easier to see that there are multiple fracture lines and that the fracture lines extend through the epiphysis into the knee joint space. This information impacts how this fracture is treated.


Abdomen
There are extensive uses for CT of the abdomen. These include a) abdominal pain, b) inflammatory conditions such as suspected appendicitis or diverticulitis, c) tumor assessment, d) enlargement of organs, e) kidneys stones, and f) obstruction of the bowel, kidneys or bile ducts.
The CTs images below are from two different patients who presented to the ER with abdominal pain. The left image demonstrates a dilated right renal collecting system (the calyces and renal pelvis) due to obstruction of the right ureter. This is commonly caused by a renal stone lodging within the ureter and obstructing the drainage of the kidney. The right image demonstrates acute appendicitis. The appendix is abnormally dilated, with swelling in the wall and inflammation around it.


New Technology
Faster CT scanners that can acquire thinner sections, and advances in computer software have significantly impacted the field of CT. Reformations into any imaging plane are now commonly performed. This augments visualization of anatomy and aids in diagnosis.
Coronal Reformats
Below are coronal reformats of an abdomen CT. The image on the left shows the relationship of the heart to the diaphragm and liver, and the course of the small and large bowel and mesenteric blood vessels.
The image on the right shows the relationship of the kidneys to the adrenal glands, and demonstrates that the kidneys are located quite posteriorly in the abdomen; as posterior as the spine, since they are both seen in this same coronal section.


3D Volume Rendering
This is a way of reformatting CT image data to produce a 3 dimensional image of selected structures, excluding the structures which are not of interest. The images can be rotated in any orientation to see the anatomy from any perspective. 3D volume rendered images are most useful in preoperative planning for complex vascular procedures or complex fractures, such as those of the pelvis or proximal tibia. A 3D volume rendered image from an abdominal CT angiogram is shown. Note that the arteries and their branching pattern is displayed. The kidneys and spine are visible, but most other soft tissue structures are not demonstrated with this technique.

CT Angiography (CTA) is a CT technique targeted to display the arteries. Traditionally, in order to see the blood vessels with this level of detail, patients would have to undergo an angiogram, which is an invasive procedure in which catheters are placed directly into the arteries and contrast injected directly into the blood vessel.
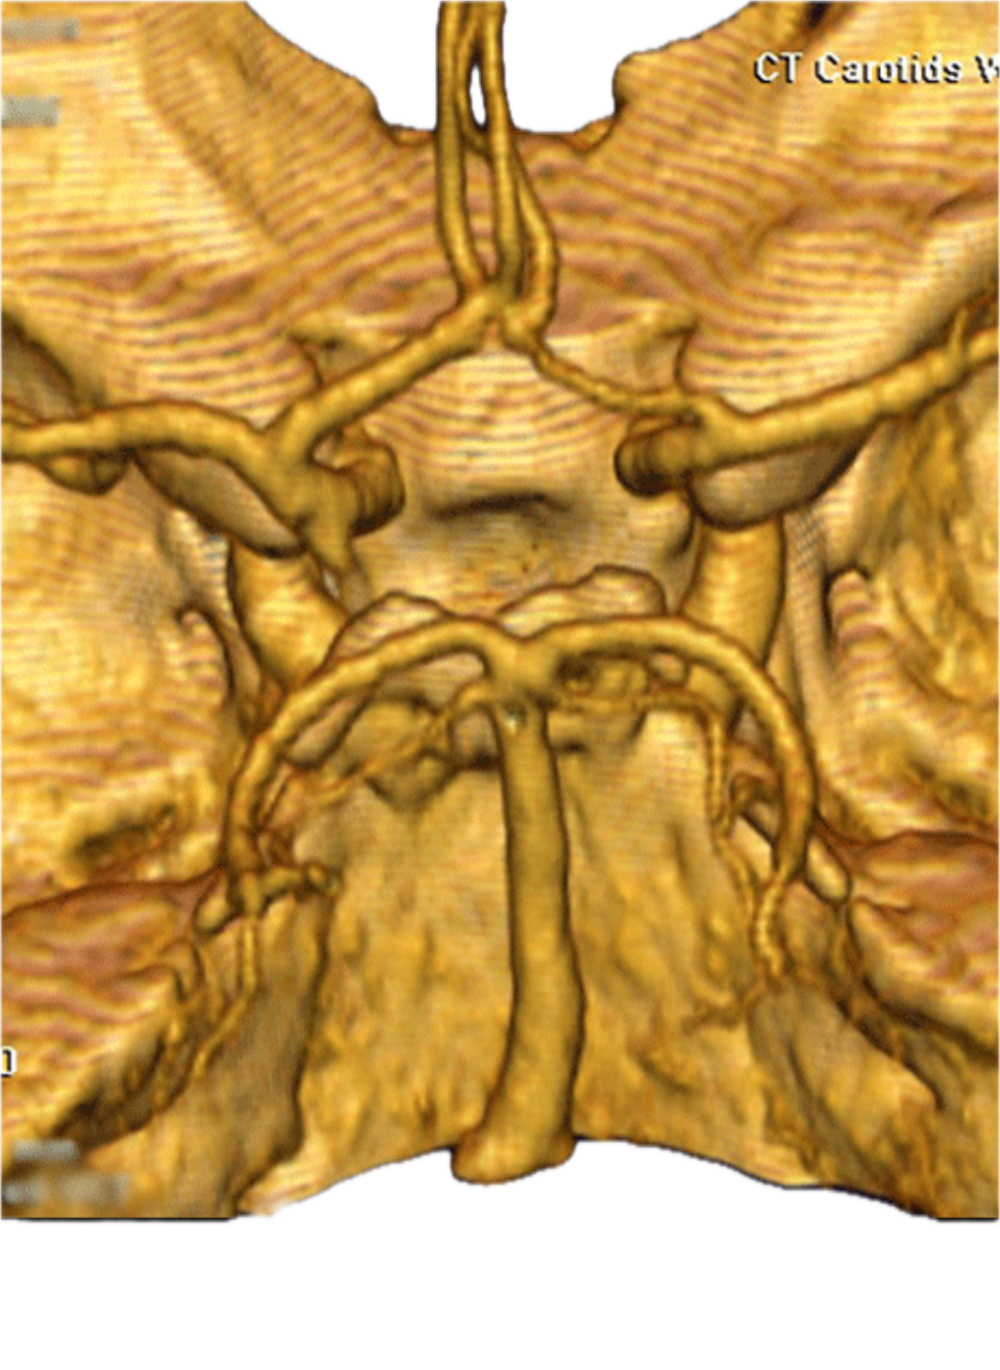
The image on the right is another example of a 3D volume rendered image from a CT angiogram of the brain. This shows the arteries supplying the brain. The tissue seen in the background is the base of the skull. Traditionally, in order to see the blood vessels to this level of detail, patients would have to undergo an angiogram, which is an invasive procedure in which catheters are placed directly into the carotid or vertebral arteries with direct intraarterial contrast injection.
This is a 3 dimensional volume rendered image of the blood vessels forming the circle of willis at the base of the brain.